Creating the monthly statistics chart of a stock, a mutual fund or a currency pair can be used to highlight the effect of “Santa Claus Rally“, “January effect” or “Sell in May and go away“.
Preparing it is not a rocket science today. With Chartoasis Sesame it takes only 3 simple steps!
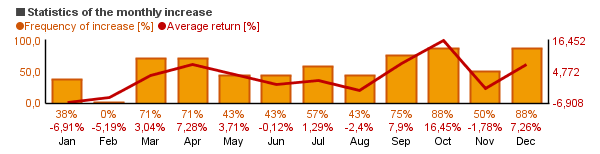
You can find a detailed description of monthly statistics chart here.
1.) Getting historical data
-
If you just want to try out Chartoasis Sesame, it has built-in example data and you can skip this step.
-
If you want to use the software for real, you will need historical data available on the internet for free. You can find help to download historical market data here.
2.) Starting Chartoasis Sesame
Chartoasis Sesame is an on-line software and it can be started by visiting www.chartoasis.com/sesame.
In case of any problem visit the troubleshooting section.
3.) Load historical data into Chartoasis Sesame
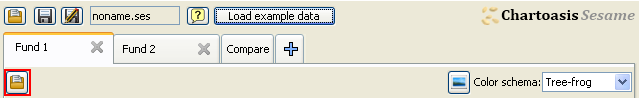
Use the button shown below to load the historical data file.
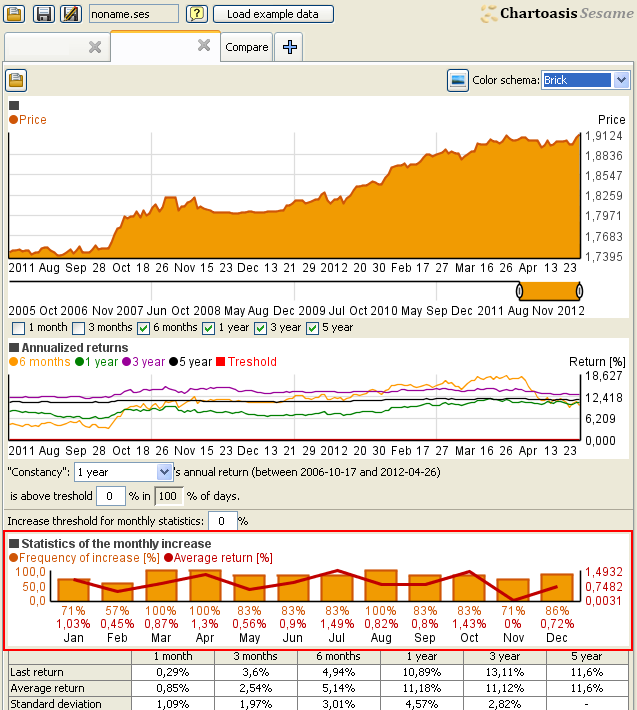
As soon as you load historical data into Sesame, monthly statistics chart appears (see below, marked with red frame).
(You can also find a detailed user’s guide here.)