What can we see on the chart?
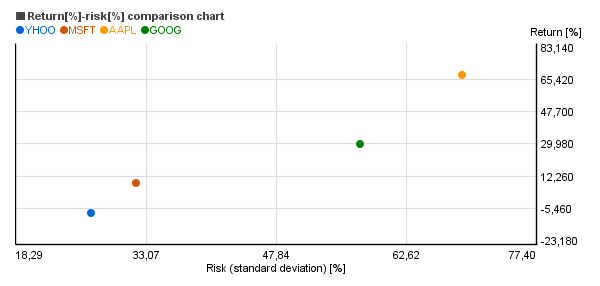
In the return-risk chart of Chartoasis Sesame (see above) on the vertical axis you can see the 1 year average return and on the horizontal axis you can find the standard deviation showing the risk of each investment in the common period.
The risk has several assessment numbers. One of them is the standard deviation, which is calculated from the difference of the return from the average return. The smaller the difference from the average return is, the smaller is the standard deviation and the risk as well. (When comparing the standard deviations it is important to remember that the standard deviation of every security must be calculated based on the same amount of data!)
Why is the standard deviation important? As the return is with 95% probability within the standard deviation band of +/-2 around the average return. And it is not at all irrelevant how wide is the band, within which the return can change, is it? (If, for example, the average return is 15% and the standard deviation is 20%, then the return will be between 15-2*20 = -25% and 15%+2*20% = 55% with a probability rate of 95%.
What is this chart useful for?
Risk means that the actual return deviates from the expected return. For a higher return you have to take normally higher risk.
As to how much higher the return will be compensating the higher risk, it differs according to the kind of the investment. Not every investment instrument pays the same return for the same risk. (See chart above.)
The wise investor strives to gain the highest possible return for the lowest possible risk. If, for example the yearly return of an investment changes between 11% and 13%, it is much better than an investment where the return changes between 2% and 22%. (The average can be 12% in both cases, but the return is more uncertain in the second case.)
Obviously, there are differences between the securities. The points, where the high return goes with low risk are located around the upper left corner in the above chart.
The investments with low risk and high return are rare to find.
- When making the selection from similar investments the balance between the return and the risk should be aimed.
- Don’t take extra risk without extra return.
- When the returns of two investments stocks are about the same, but their risk is considerably different, you should choose the one with lower risk!