Are you considering investing in Franklin Utilities Adv?
The investment decisions are normally made based on traditional technical or fundamental analysis.
However, much more is hidden in the rate data!

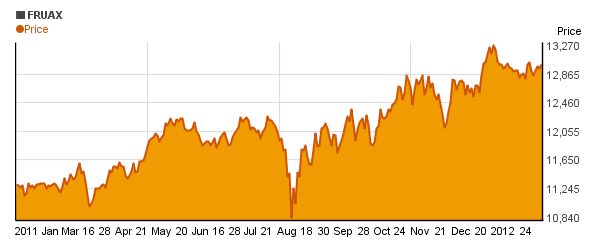
When is it more advantageous to invest in Franklin Utilities Adv?*
Many of you heard already about the Santa Claus rally and about "Sell in May and go away", but do they have the same effect to every security? Not every month performance is equally good on the market - Franklin Utilities Adv (FRUAX) is no exception.
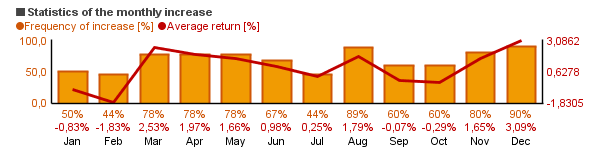
The Sesame application of Chartoasis can show you exact statistics:
how frequently the individual months produced an increase.
Gives you the average increase in monthly break-up. (See example below)
You can even elaborate a short term strategy based on the outstanding deviations. For long terms the statistics can be used for the timing of the position opening (it may be advisable for example to make a long term investment at the end of a low performer month).
What can you expect?*
Should you make a short term (e.g. 1 month) or long term (e.g. 3 years) investment in Franklin Utilities Adv you are advised to consider (see the table below):
- the average return, because if it deviates from the current return, it may be an indicator flag.
- the risk (standard deviation).
The risk has several assessment numbers. One of them is the standard deviation, which is calculated from the difference of the return from the average return. The smaller the difference from the average return is, the smaller is the standard deviation and the risk as well. (When comparing the standard deviations it is important to remember that the standard deviation of every security must be calculated based on the same amount of data!)
Why is the standard deviation important? As the return is with 95% probability within the standard deviation band of +/-2 around the average return. And it is not at all irrelevant how wide is the band, within which the return can change, is it? (If, for example, the average return is 15% and the standard deviation is 20%, then the return will be between 15-2*20 = -25% and 15%+2*20% = 55% with a probability rate of 95%.
- the best case and worst case returns, because by calculating them you can assess the possible loss if your expectations fail.
| 1 month | 3 months | 6 months | 1 year | 3 year | 5 year | |
|---|---|---|---|---|---|---|
| Last return | -0.31% | 2.52% | 8.97% | 15.76% | 14.33% | 5.12% |
| Average return | 0.92% | 3.16% | 6.53% | 13.32% | 12.2% | 5.12% |
| Standard deviation | 4.18% | 6.29% | 10.09% | 16.59% | 9.16% | - |
| Max. return | 9.23% | 12.11% | 18.8% | 24.14% | 20.1% | 5.12% |
| Min. return | -21.35% | -14.6% | -24.34% | -29.21% | 2.16% | 5.12% |
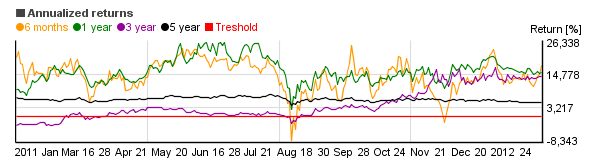
Long term investment*
For long term investments one expects that the return is more certain then in the case of a short term investment.
With Chartoasis Sesame application you can identify for example the percentage of time when the Franklin Utilities Adv return curve was over 10% during a 3 years period (see the chart below). More simply, this calculation means that, based on the past, you can get an assessment: what is the chance that your 3 years return will be over 10%. As you can see, longer periods have less deviation.
*The above charts were prepared using the Chartoasis Sesame application. The data and the charts may not be up-to-date and they may not represent all the data available.
We suggest you to always use the latest data for your investment decisions. You can prepare similar charts easily on the www.chartoasis.com/sesame/start-sesame website.
The charts and the tables are based on the data of the past and they represent no guarantee for the future performance.