Download free market data of stocks, indices, commodities and forex
Where to download free market data from?
Finding stock data by country
When looking for a stock's market data from a certain country you should find the country's page about downloading market data first. Eg.: You should visit USA's page to see how to download market data of stocks from the USA.
Finding forex, index, commodity data
Below table is a summary which free data provider supports which equity category. You can reach the download guides through the links in the list of download guides.
| type | Yahoo! Finance |
Stooq.com |
|---|---|---|
| Index |  |
|
| Commodities | |
|
| Forex | |
Details about the free market data providers
Market data is downloadable for free from sites below (there is a download guide for each data provider):
| Yahoo! Finance | Yahoo! Finance Download help |
| Yahoo! Finance UK | Yahoo! Finance UK Download help |
| Google Finance | Google Finance Download help |
| RTS | RTS Download help |
| Stooq.com | Stooq.com Download help |
| Portfolio.hu | Portfolio.hu Download help |
| NSE India | NSE India Download help |
| MSCI Index | MSCI Index Download help |
Above pages vary not only in the supported equities but in other services too. When looking for free data of a product you should take a look at the table of dataproviders per product or the country index where a free data provider is listed for each equity category.
- Yahoo! Finance: Chartoasis.com's chart software shows the market price instead of the price adjusted for dividends (whichs is also listed in the downloaded data file). Yahoo! Finance stores data of a very long period in some cases (eg.: GE - since 1962). Download interval is the longest possible interval by default. Downloading data can be made easier by saving the links of product's data download page to "Favourites" or "Bookmarks".
- Yahoo! Finance UK: It's properties are similar to the global Yahoo! Finance page.
- Google Finance: Most data is meant without dividend correction but in most cases data contain correction for splits. Downloading data can be made easier by saving the links of product's data download page to "Favourites" or "Bookmarks".
- RTS: There is no opportunity to save any link to "Favourites" or "Bookmarks". Take care of missing data in the data files. Prices' currency may vary.
- Stooq: Downloading data can be made easier by saving the links of product's data download page to "Favourites" or "Bookmarks". In some cases there is an opportunity to download prices with split or dividend correction.
- Portfolio.hu: It contains the most up to date market data for Hungarian equities. Besides stocks you can download price data of Hungarian bonds, certificates and investment funds. There is no opportunity to save any link to "Favourites" or "Bookmarks".
What do you have to take care of when downloading free market data?
Chartoasis.com's chart software can draw charts using the downloaded data only. For this reason users must know exactly what kind of data has been downloaded.
- It depends on many factors how up-to-date the data is:
- Time of market closure: In many cases market closure happens in the afternoon (according to local time of the market!) but if market is continuous (eg.: like in the case of commodities) data is summarized at midnight.
- Updating data: Some providers tell market data before market closure - in this case closing price is the actual price of the equity on the market. It may happen, that closing price is available before market closure but volume data is not accessible. It can also happen that data is updated after market closure with a delay. If market data you want to analyze is available at different providers (see the table of dataproviders per product and the table of alternative data providers for countries) you have to experience which one suits you better.
- Daily / weeklyresolution: chart software awaits daily data. Weekly data must not be downloaded, it is calculated by the chart software itself.
- Amount of data: using too few data may cause inaccuracy of indicators and functions of market data. When selecting period to download take care of that some methods depend on the amount of data. Eg.: a SMA with a parameter of 200 on weekly data need at least 200 weeks' data to have a valid result at all so it requires more than 3 years' data. It is recommended to download as much data as possible.
- Split and dividend: dividends and stock splits can cause jumps in market price that have effects on the indicators and signals read from them. You should take care of if data contains correction for splits and dividends. (Also take care of that the usual percentage of dividends vary from year to year and from country to country. eg.: some companies pay dividend 4 times a year (having less effect on the market price) but others pay dividend once a year).
- Trading volume and prices: there are equities traded on more markets and prices are not exactly the same on each market. (Eg.: because there is some natural difference between markets or markets do not close in the same time). Volume may reflect the trading volume of one market only. Trading volume is given as number of traded shares in most cases but in some cases only the turnover (sum value of transactions) is given. For some intervals volume data may be completely missing. You always have to take care of what kind of market data is downloaded.
- Currencies, numbers: Currency of prices in downloaded data may not be univocal in all cases since some data providers provide data in more currencies. It may happen that you download data of Gazprom from RTS in USD but the dividend is given in RUR on the website of the company. Numbers may be rounded, too.
- Errors in data: Data providers do not check all numbers they provide, downloaded data may contain inconsistencies and errors. Having experienced weird things on the chart? We recommend you to check downloaded data because the root cause of problems may lie in the data itself. (Eg.: missing data, filled with zeros, daily minium is higher than the maximum and so on...) Take a look at the example below.
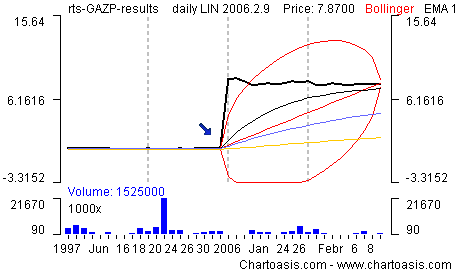
Data of Gazprom downloaded from RTS. The jump in the price marked with the arrow is caused by a large amount of missing data (left side of charts is 1996 and right side is 2006)