Looking for free trading analysis software? We offer you a solution, that can help you before and after trading.
Analysis before trading
Chartoasis Chili offers you various functions to analyze an equity before opening a position on the market, and you can use it for free as long as you want.
Technical analysis functions
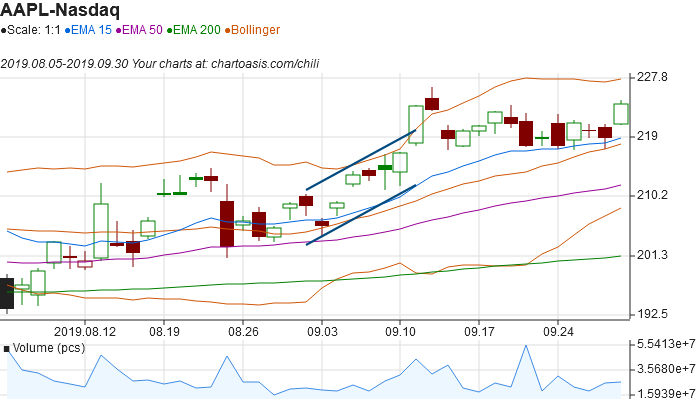
The new software has the essential technical analysis functions, like:
- candlesticks,
- moving averages,
- Bollinger bands,
- technical indicators like MACD, RSI etc.
- drawing patterns like channel, wedge etc.
Check out the full set of technical analysis features here.
Complementary analysis functions
Besides technical analysis it may be a good idea to have a look at some other charts:
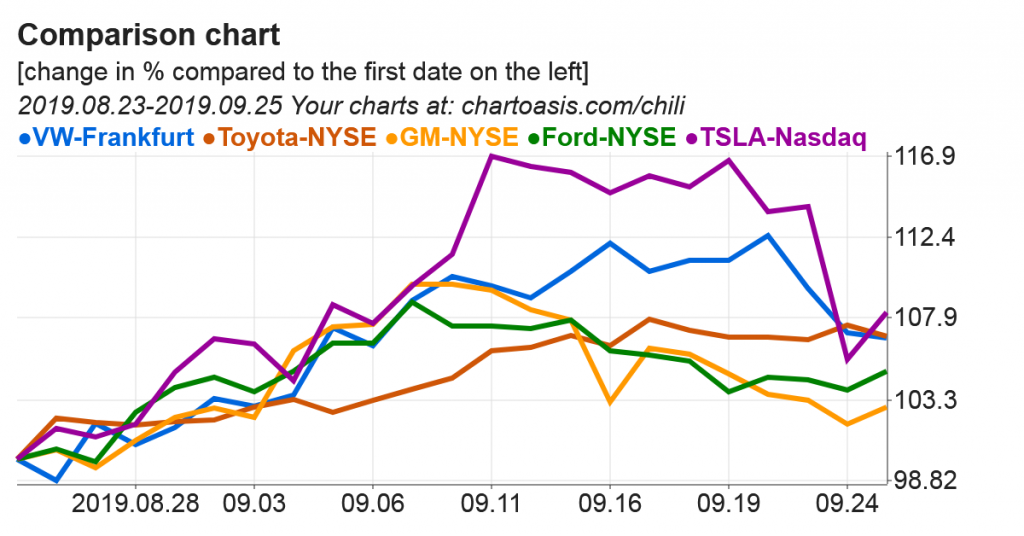
- Chartoasis Chili allows you to create a comparison chart where the relative change of each instrument can be observed. This may reveal, whether an instrument is under-, or outperforming its competitors, or the related index.
- If you take a position in a foreign currency, it is also recommended to consider currency rates. Our software offers free, built-in currency rate charts as well.
Analysis after trading
It may sound suprising, that there is anything left to analyze after a closed position, but there is, and it is very important. Reviewig previous successes and failures allows learning from them.
The basic analysis of previous deals can be made very simple using a spreadsheet application. There are very good free spreadsheet applications on the market, like Libre Office Calc, or Google Spreadsheets.
I would record trades in a table with informations like
- name of instrument,
- buying and selling date
- reason for opening and closing position (eg.: this or that indicator was below X%)
- success or failure
- gain and loss
(You may want to record other things, too.)
After you have recorded such data, you can perform analysis with eg.: subtotal and filtering functions. (Learning these may help you in other areas of life, too.) As an example, I would filter to a specific reason for opening and closing a trade, and count success to failure ratio.
You can also create a table like this for backtesting a strategy – meaning, that you observe the past behaviour of the stock while acting according to a strategy without making any actual trade.
This is a very simple method to analyze after having closed a couple trades. There may be some more sophisticated tools, too.
Try it now for free!
It takes only 1 click, and you can try Chartoasis Chili!
It loads sample data right at the beginning, so you can try any feature right now.