Looking for a free stock analysis software?
We think, that stock analysis is a complex process and our software support it in multiple ways:
Technical analysis
Chartoasis Chili has the essential technical analysis functions, like:
- candlesticks,
- moving averages,
- Bollinger bands,
- technical indicators like MACD, RSI etc.
- drawing patterns like channel, wedge etc.
Check out the full set of technical analysis features here.
Market and competitor analysis
When you want to invest in a stock (especially for longer term), it is interesting to know, how it performs compared to
- stocks on the same market, or the index of that particular market
- stocks in the same industry
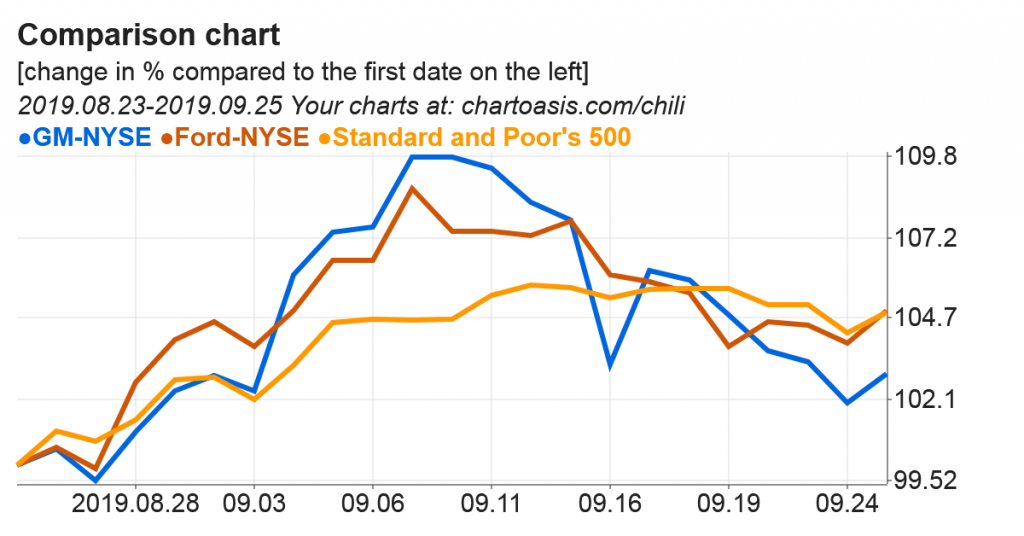
This means that we check if a stock is underperforming or outperforming other instruments. Chartoasis Chili also supports this with a special chart, that shows the change of each stock price relative to the same date. The chart looks like this:
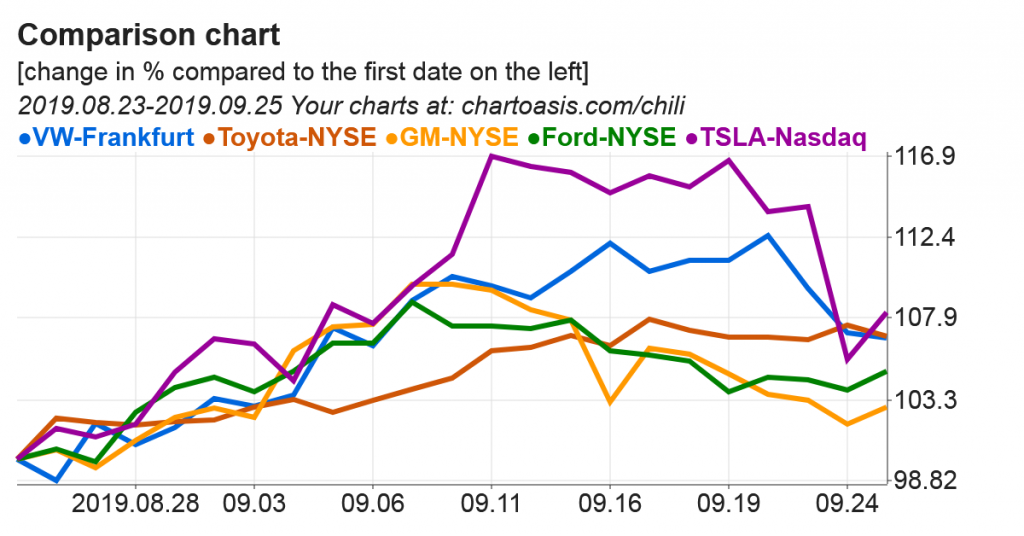
The chart above shows an example for comparing stocks in the same industry. However,
- if you load data of an index to a tab, or the data of a stock in the same market, then you can carry out the analysis of the market, too.
- you can also select a time range longer than 1 month.
Fundamental analysis
Classical fundamental analysis of stocks is currently not supported in Chartoasis Chili. This is mainly, because:
- KPIs of fundamental analysis are easily found on large financial portals.
- Interpretation of news is way more complex than just drawing a chart.
Currency rates
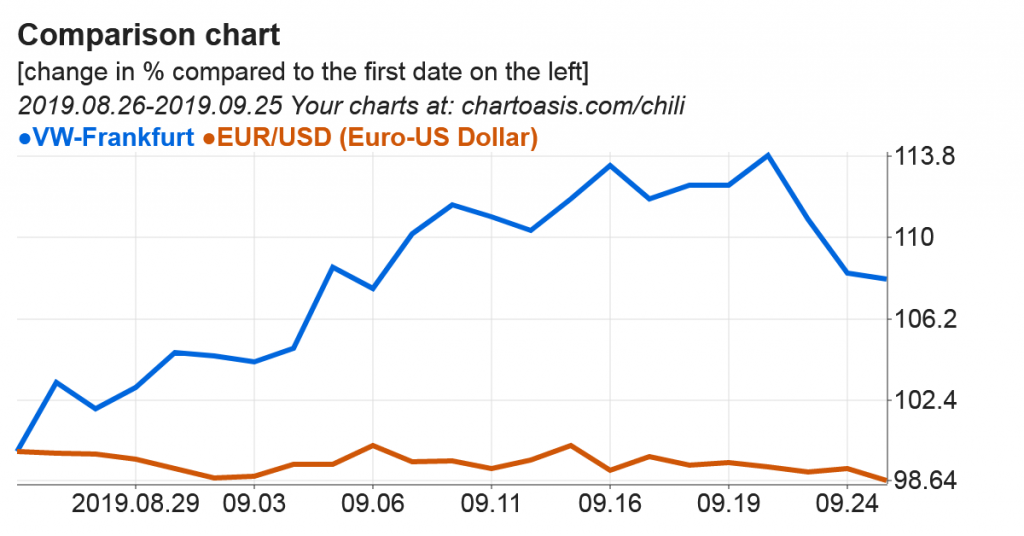
However, there is a fundamental factor, that you should consider if you are investing in a stock in a foreign country. This factor is the currency rate.
Chartoasis Chili contains built-in currency rates, so if you are analyzing a foreign stock, you can check the chart of the foreign currency very easily. You can also compare the stock price against the currency rate change (in the example below, VW stock has performed well, but EUR/USD rate change made its performance a little worse counted in US Dollars):
Try it now for free!
It takes only 1 click, and you can try Chartoasis Chili! You can use it for free as long as you want.
It loads sample data right at the beginning, so you can try any feature right now.