Help for the free technical analysis software of www.chartoasis.com
Downloading market data
Chartoasis.com's stock analysis software works with free market data that have to be downloaded and loaded into the software by the user. Currently supported data sources allow the technical analysis of many countries' stocks and exchange rates, for supported countries see page "Supported countries". For more information about supported products and downloding market data please visit the "Data download" menu.
Starting the chart software
Installing java
You need the appropriate version of Java installed to run the chart software. In case of the proper version of Java is not installed, either
- the browser offers the automatic installation of the proper version of Java when trying to start the chart software (this depends on your browser) or
- you have to install it manually. Please visit our Java install guide to see how to do it.
- In case of any problem occurs during the installation of Java or the chart software is still not working, please see the notes at the end of our Java install guide and our FAQ (Frequently Asked Questions) page.
Starting the application and security questions
Chart software can be started from the site's Analysis software / Start online software menu. At the beginning a window like this may pop up:
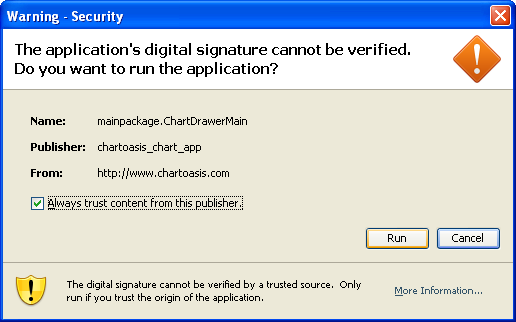
This is because the chart software is a Java applet and processes stock data files that are selected by the user. Java applets need user permission to open data files. You have to accept the unique digital signature of the program to authorize the chart software to read your stock data. (This is what the above window asks.) To proceed with the chart software you have to click "Run" which grants the necessary permissions for reading stock data files you choose for analysis. (Only the files you select for analysis will be read.) The chart application can not be used without this. You will see this window every time the chart software starts unless you check the "Always trust content from this publisher" checkbox (like on the picture).
Using the software
Loading data files
You can load the wanted stock's data file by pressing the ![]() button.
button.
Informations shown on the chart
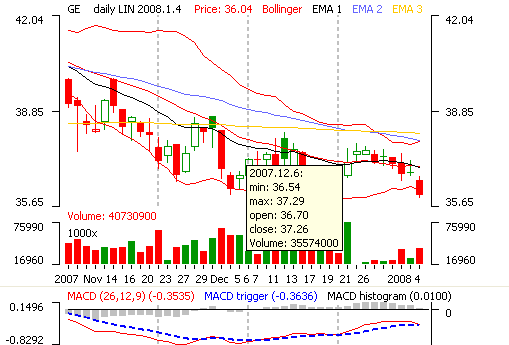
The chart of market price and the axis of time is always visible. If the data file of the stock contains trading volume information its chart is also visible.
- In the header of price chart you can see the name of equity [in this example: GE] (The name that is shown comes from the name of the data file, or it may come from the content of the data file - if such information is contained within the file. You can change the name shown in the local menu by clicking the ![]() button on the right). Next to the name you can see the resolution of the time axis [daily / weekly], the type of price axis [linear or logarithmic], and the timestamp with the closing price of the last visible point on the right [2008.1.4 and 36.04]. You can also see the name of the moving averages and the Bollinger bands with the color they are drawn on the chart (eg.: EMA 2 is the blue line on the chart.)
button on the right). Next to the name you can see the resolution of the time axis [daily / weekly], the type of price axis [linear or logarithmic], and the timestamp with the closing price of the last visible point on the right [2008.1.4 and 36.04]. You can also see the name of the moving averages and the Bollinger bands with the color they are drawn on the chart (eg.: EMA 2 is the blue line on the chart.)
All moving average and Bollinger Band parameters along with the linear / logarithmic, candlestick or curve settings can also be set up in the menu by clicking the ![]() button on the right.
button on the right.
- Price chart can be drawn with continuous line or with candlesticks. There may be moving averages and Bollinger bands on the price chart, too. If you move the mouse above the price chart, a tooltip box will pop up showing the market data of the day / week under the cursor like on the picture (2007.12.06., the format is yyyy.mm.dd) (you may need to click on the price chart first to see the popup box). The price axis shows the minimum, maximum and the middle of the price range shown on the price chart.
- Candlesticks are red if closing price is less than the closing price in the previous period, and green if the price closes higher than in the previous period. The body of the candlestick is empty if the price closes higher than the opening price of the same period and the candlestick's body is filled if the given period's closing price is less than the opening price of the same period.
- The volume chart's header shows the volume of the last visible point on the right. Numbers read from the volume axis should be multiplied by the number shown on the right of the volume axis ("1000x", in this case) to get the approximate trading volume (number of shares or turnover) of the observed period. The bars in the volume chart are green if the price closes higher than the closing price in previous period, and red if it closes below the previous period's closing price, just like the candlesticks.
- Headers of other charts contain the following informations: name of the price function [MACD in this case], parameters of price function [26,12,9], and the value of the price function in the last visible point in the right [-0.3535]. If chart consists of more price functions, the curves' colour is the same as the colour of their names (and value) in the header.
Settings of time axis
Adjustments of time axis can be made with the controls in the upper right corner of the chart:
- The number entered in the "Nr. of records" field tells how many records (days, weeks, etc.) should be shown on the same chart simultaneously.
- "daily" and "weekly" radiobuttons change between the weekly / daily view. (Do not mind that you did not download weekly data, it is calculated by the chart software from the daily data)
- ![]() and
and ![]() means stepping the time window bakcward or forward by one period (day, week, etc.) Using these buttons combined with the following ones enables viewing all downloaded date.
means stepping the time window bakcward or forward by one period (day, week, etc.) Using these buttons combined with the following ones enables viewing all downloaded date.
- ![]() and
and ![]() means stepping the time window bakcward or forward by X period (day, week, etc.) where X is the number you set in the "Nr. of records" field, so this means stepping by a "window".
means stepping the time window bakcward or forward by X period (day, week, etc.) where X is the number you set in the "Nr. of records" field, so this means stepping by a "window".
Editing charts
All charts except for the price chart, volume chart and time axis is freely editable, can be created and deleted. You can create more charts of the same type (eg.: more MACD with different settings to observe how good a setting performs.)
![]() : Adds an instance of the chart as the last one of the chart list (you will see the newest chart at the bottom of the scrollbar).
: Adds an instance of the chart as the last one of the chart list (you will see the newest chart at the bottom of the scrollbar).
![]() : Remove this chart.
: Remove this chart.
![]() : Open the chart's Settings menu.
: Open the chart's Settings menu.
Drawing channel, wedge, placing markings
Areas of price chart may be marked by channels or wedges. Certain points may also be marked by arrow, number or a character.
- To add a new marking pick the marker from the menu on the right and place it on the price chart by left-clicking on the wanted position.
- To move an existing marking: you can drag the marking to the wanted position by keeping pressed your mouse's left button.
- To remove an existing marking : select the item that is to be removed by shift+left click, then press the del button of the keyboard.
The available markings are the following:
![]() : The wedge consists of two lines with all endings freely movable. The wanted shape of wedge can be formed by dragging the endpoints to the wanted positions. The entire shape can be dragged by dragging one of the lines.
: The wedge consists of two lines with all endings freely movable. The wanted shape of wedge can be formed by dragging the endpoints to the wanted positions. The entire shape can be dragged by dragging one of the lines.
![]() : The channel consists of two lines that are always guaranteed to be parallel. You can set the angle of the channel by draggin one of the endpoints of the line, the width of the channel can be set up by rolling the middle / scroll button of the mouse. The entire shape can be dragged by dragging one of the lines.
: The channel consists of two lines that are always guaranteed to be parallel. You can set the angle of the channel by draggin one of the endpoints of the line, the width of the channel can be set up by rolling the middle / scroll button of the mouse. The entire shape can be dragged by dragging one of the lines.
![]() : A newly created point marking shows the number / character written in the textfield on the right of the radiobutton (press enter after you inputted the number / character). Having placed the marking the number / character is stepped to the next one.
: A newly created point marking shows the number / character written in the textfield on the right of the radiobutton (press enter after you inputted the number / character). Having placed the marking the number / character is stepped to the next one.
![]() : Arrows can point into 8 directions. Direction can be modified after placement by right clicking on the shape.
: Arrows can point into 8 directions. Direction can be modified after placement by right clicking on the shape.
Saving as image
The chart you made can be saved as image eg.: to document your analyis. The window of image export can be opened with the ![]() button:
button:
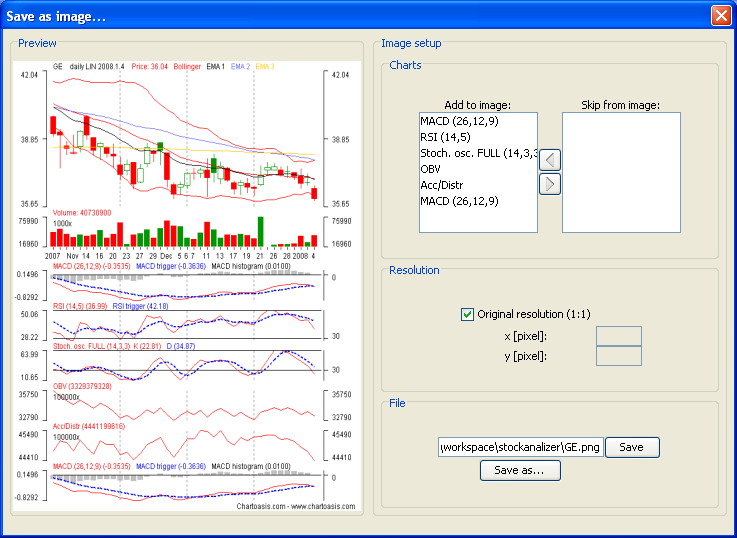
- Left pane shows a preview of the image already set up.
- Right pane's
- top panel lets you define which charts should be visible on the image. (Removing a chart from the image does not mean deleting it.)
- middle panel lets you define the resolution of the resulting image. If you keep the "Original resolution (1:1)" checked image will not be resized and will be as large as it is on the screen in normal chart window. Resizing may cause poor image quality.
- bottom panel allows you to configure the image file's name. (Only .png format is supported!)