Search
Skip to content
  • Home
  • Financial charts
    • Commodity price charts
    • Cryptocurrency charts
      • Bitcoin price chart
      • Ethereum price chart
      • Litecoin price chart
      • Ripple price chart
      • XRP chart
    • Forex charts
    • Stock index charts
    • Treasury rate charts
    • USA stock charts
  • Chart softwares
    • Data download
      • Data download from Quandl.com
    • Example charts
    • Free chart app
      • Features
      • Start
      • Supported countries
  • Free e-book
  • FAQ
  • Blog
    • Calendar effects
    • Forex
  • News
  • Popular
    • Australian dollar 5 years chart
    • Crude oil 5 years chart
    • Euro to INR 5 years chart
    • Free technical analysis software
    • Hang Seng index 5 years chart
    • Pound to Euro 5 years chart
    • Turkish Lira to USD 5 years chart
    • USD to CAD 5 years chart
    • USD to INR 5 years chart
  • Quiz
    • Book quiz
    • Daily quiz of various topics
    • Gaming quiz
    • Movie quiz
    • Music quiz
Uncategorized

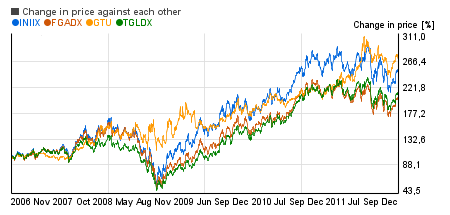
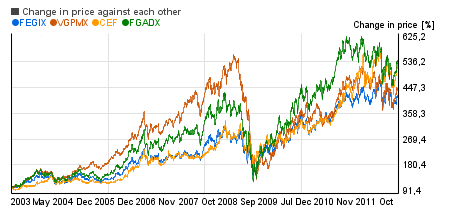
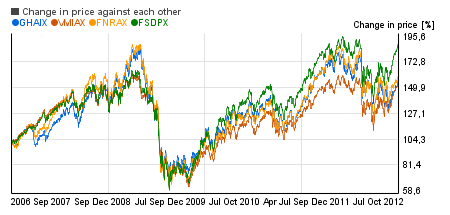
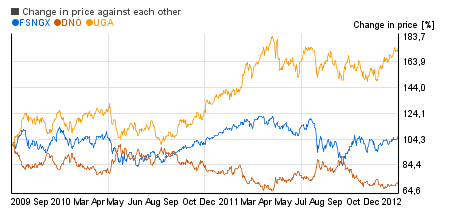
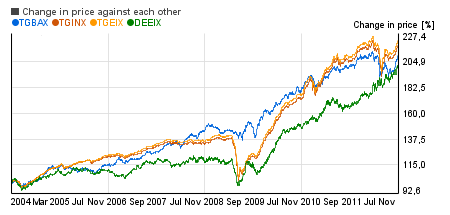
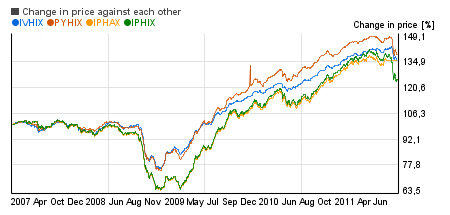
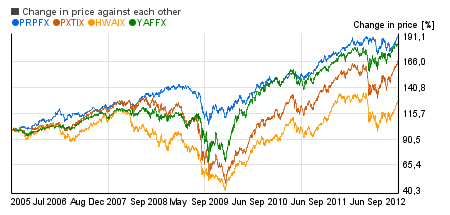
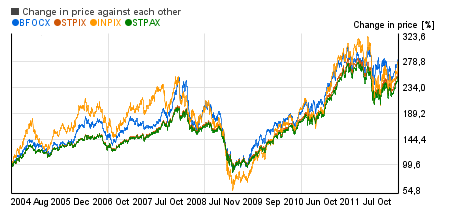
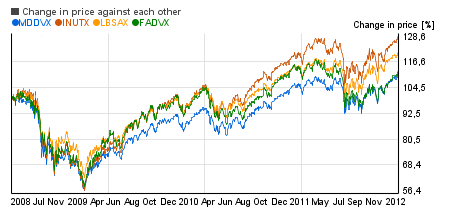
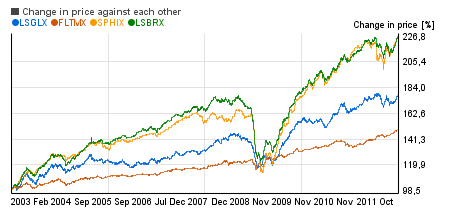
Mutual funds chart examples made with Chartoasis Sesame

Chartoasis Sesame is a chart software providing unbelievable useful special support for making investment decisions - both for short and long term decisions.
Check out links below to see examples how Chartoasis Sesame can help you.

Try Chartoasis Sesame NOW for free!
Try Chartoasis Sesame NOW! It's easy as 1-2-3!

Click here, and find out what else is hidden
in the gold mutual funds price data!

Gold mutual funds top performer  image

Click here, and find out what else is hidden
in the precious metal mutual funds price data!

Precious metal mutual funds top performer  image

Click here, and find out what else is hidden
in the commodity mutual funds price data!

Commodity mutual funds top performer  image

Click here, and find out what else is hidden
in the oil & gas mutual funds price data!

Oil & gas mutual funds top performer  image

Click here, and find out what else is hidden
in the energy mutual funds price data!

Energy mutual funds top performer  image

Click here, and find out what else is hidden
in the growth funds price data!

Growth funds top performer  image

Click here, and find out what else is hidden
in the index funds price data!

Index funds top performer  image

Click here, and find out what else is hidden
in the utility mutual funds price data!

Utility mutual funds top performer  image

Click here, and find out what else is hidden
in the bond mutual funds price data!

Bond mutual funds top performer  image

Click here, and find out what else is hidden
in the high yield mutual funds price data!

High yield mutual funds top performer  image

Click here, and find out what else is hidden
in the stock mutual funds price data!

Stock mutual funds top performer  image

Click here, and find out what else is hidden
in the technology mutual funds price data!

Technology mutual funds top performer  image

Click here, and find out what else is hidden
in the dividend mutual funds price data!

Dividend mutual funds top performer  image

Click here, and find out what else is hidden
in the high dividend mutual funds price data!

High dividend mutual funds top performer  image

Post navigation

Previous PostNext Post

Chartoasis.com: financial charts and chart software

Chartoasis.com: financial charts and chart software

TOP financial charts

EUR/USD chart
USD/JPY chart
GBP/USD chart
Gold chart
S&P 500 chart
Oil chart
DAX chart
NASDAQ chart

Charting software articles

Best free technical analysis software
Best stock analysis software
Best stock charting software
Best technical analysis software
Free EOD technical analysis software
Free stock analysis software
Free stock charting software
Free stock market analysis software
Free stock market charting software
Free technical analysis software
Free technical analysis software with buy sell signals
Free trading analysis software

Follow us!

Chartoasis.com Facebook page Chartoasis.com X page

RSS newsfeed

RSS icon RSS

Informations

  • About us…
  • For webmasters
  • Contact us
  • Guest posts
  • Chartoasis.com: financial charts and chart software
  • Our Partners
  • Privacy Policy
  • Popular
    • Australian dollar 5 years chart
    • Crude oil 5 years chart
    • Euro to INR 5 years chart
    • Hang Seng index 5 years chart
    • Pound to Euro 5 years chart
    • Turkish Lira to USD 5 years chart
    • USD to CAD 5 years chart
    • USD to INR 5 years chart
  • Terms of service

Financial charts & charting software blog

  • How to use Eodhd.com, even for free?
  • Embeddable charts with your brand
  • Currency chart widget with your brand
  • Forex chart widget with your brand
  • Embed forex chart with your brand

Personalized ad / analytics cookies

Privacy and cookie settings.
©Chartoasis.com: financial charts and chart softwares. Design by Kelemen Szabolcs
Chartoasis Ltd. 133 fsz 4. Fehervari str., Budapest, Hungary H-1116 (VAT reg. no. HU23996685)

Useful financial chart and chart software links

AMZN stock chart, Apple stock chart, Bitcoin 10 year chart, Bitcoin 5 year chart, ETH chart, ETH price chart, Ethereum chart, Ethereum price history, EUR-USD historical chart, Euro to Dollar history chart, Euro to Dollar history chart 20 year, Euro to Dollar history chart 5 year, Euro to Turkish Lira chart, GBP to USD historical chart, Lite coin chart, Litecoin chart, Litecoin live price, Litecoin price chart all time, Live Ethereum price, Live Litecoin price, META stock chart, MSFT chart, NVDA stock chart, Pound to Dollar chart history, Price of ETH, Ripple chart, SGD to USD chart, SGD-AUD chart, SGD-MYR chart, Swiss Franc to USD historical chart, Syrian Lira to USD chart, Tesla stock chart, TSLA stock chart, Turkish Lira to Dollar chart, USD to SGD chart, USD to Turkish Lira chart, USD-TRY chart, XRP live price, XRP price chart, XRP Ripple chart
Proudly powered by WordPress