Good statistics is the key to calendar effects
Many investments show calendar effects like as Santa Claus Rally, January effect, Halloween indicator, October effect. Some of them may be just a coincidences but a lot of them are statistically significant.
Having checked monthly trends of many cases we must say that these calendar effects are not equally strong in the case of each investment. Some of them are very strong (check out the chart below), others may be weaker or completely missing. One can also discover important seasonal tendencies other than the effects mentioned above, regarless on talking about stock market, commodities, forex pairs, indices or mutual funds / ETFs.
Since these effects vary with investments it is better to analyze their effect for each investment separately. This analysis can be made e.g.: per month in a chart like below:
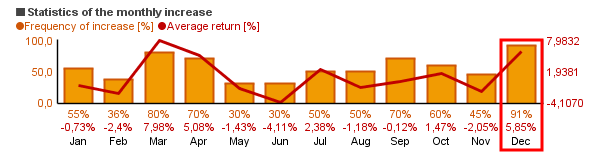
Two values are displayed above the names of months:
- How often did the price change between the starting day and closing day of a month exceed zero. (In the example above the price of the investment was rising in 91% of the cases in December. Quite good example of Santa Claus Rally, isn’t it?) To consider the effect of transaction fees you may want to use a threshold other than zero. (See here.)
- Average of increases between the starting day and closing day of months. (In the example the average price increase was 5.85% in December.)
The chart above is a basic calendar effect chart. You can find more information about the detailed chart here.
How to make calendar effect analysis?
Calendar effect analysis takes only 3 steps using the free software Chartoasis Sesame:
1.) You need (enough) enough data
Chartoasis Sesame works with free historical data.
-
If you just want to try out Chartoasis Sesame, it has built-in example data and you can skip this step. Just press the “Load example data” button.
-
If you want to use the software for real, you will need historical data available on the internet for free. You can find a complete guide to download historical data here.
In order to get reliable results at least 10 years’ data is recommended.*
2.) Start Chartoasis Sesame
Chartoasis Sesame is an on-line software and it starts when visiting www.chartoasis.com/sesame .
In case of any problem visit the troubleshooting section.
-
Browser may ask for installing Java plugin.
-
There were temporary problems using the software with Firefox or IE ? best experience is guaranteed with Google Chrome.
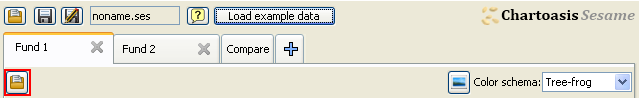
3.) Load historical data into Chartoasis Sesame
Use the button shown below to load the historical data file.
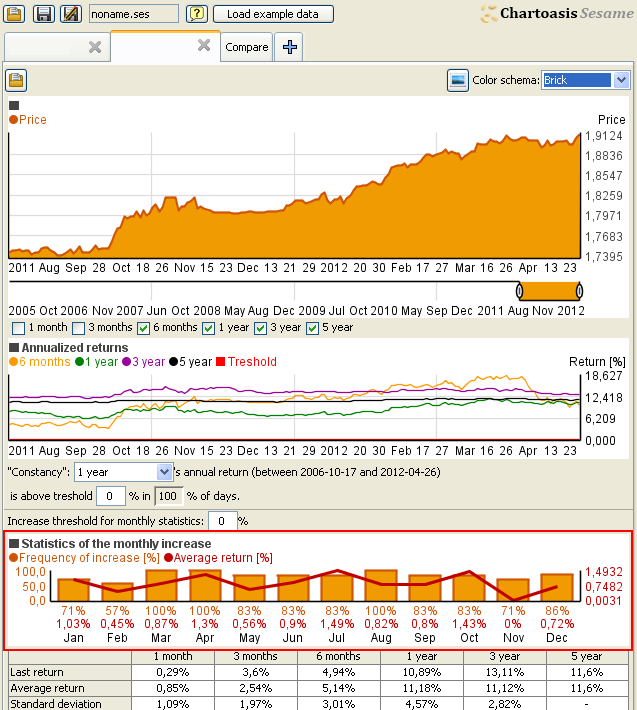
As soon as you load historical data into Sesame, monthly statistics chart appears (see below, marked with red frame).
(You can also find a detailed user’s guide here. Eg.: it explains how to consider transactional fees.)
*It must be noted, that past behavior does not represent any guarantee in terms of future performance! Investing may carry a high level of risk, and may not be suitable for all investors. Before deciding to invest into a stock, a commodity, a mutual fund, an index or a currency pair you should carefully consider your investment objectives, level of experience, and risk appetite. Also remember that short term invesments carry higher risk than long term ones. By visiting this site you accept our terms of service.