Technical analysis seeks trading opportunities through analyzing statistical trends of price and volume changes. This investing discipline works only if statistics can be applied, which is true for Ethereum as well.
When is it possible to use it?
One should remember, that there are cases when statistics can be misleading, eg.:
- If the statistics was not derived from long enough historical data. Eg.: an indicator resulting in positive profits with Ethereum twice out of two cases is definitely not enough.
- If the current situation differs from the conditions when statistics was calculated. Eg.: one can detect a chart pattern, which has resulted in rising price of ETH/USD 49 times out of 50 occurrences in “normal” market conditions, but it is not wise to rely on when there is a selling pressure on cryptocurrecies, because there is a worldwide bear market.
So when trading Ethereum based on technical analysis, fundamental factors (eg.: worldwide bear market, changes around cryptocurrency mining) should always be kept in mind to some extent.
Options to perform technical analysis
If you want a quick and easy way for technical analysis of ETH/USD, Chartoasis Chili offers a browser based, comfortable and free solution, which works well even on mobile devices.
With built-in data
The software supports the following technical analysis features also for Ethereum with built-in EOD data:
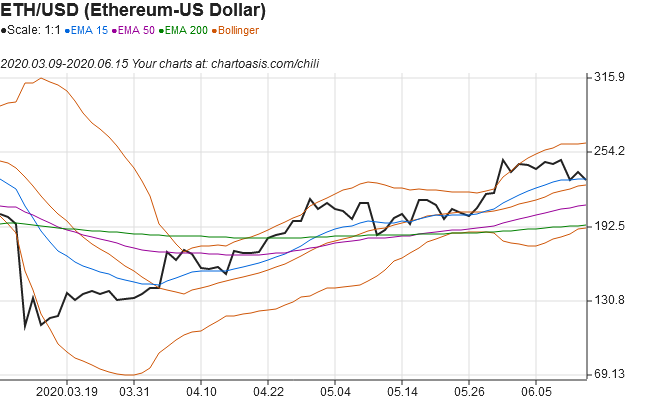
- Moving averages
- Manually set chart patterns
- Bollinger bands
- MACD indicator
- RSI indicator
All indicator and moving average parameters can be customized.
An other benefit of the built-in data is that you can switch from ETH/USD to eg.: ETH/EUR or any other currency pair by one click.
With free historical data
If you download OHLC data for Ethereum, you can perform a more in-depth analysis.
(Chartoasis Chili can import nearly any historical data. It will either recognize the format automatically, or it will guide you through the importing process thanks to the importing wizard.)
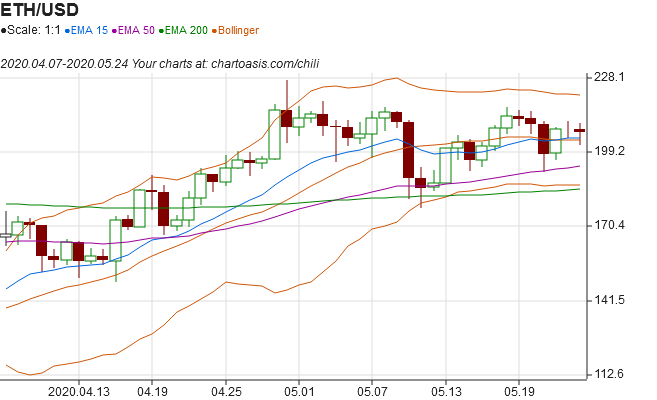
OHLC data enables additional technical analysis features like:
- Candlestick chart
- Stochastic oscillator indicator
- OBV indicator
- Accumulation/Distribution indicator
Feel free to proceed with trial of Chartoasis Chili. It’s free!